The other day I had a situation where I needed to debug network traffic between an app and its Envoy sidecar proxy. Fortunately, since the app image was Ubuntu-based and it was an unimportant dev cluster, I was able to just kubectl exec into a shell on the container and apt install tcpdump.
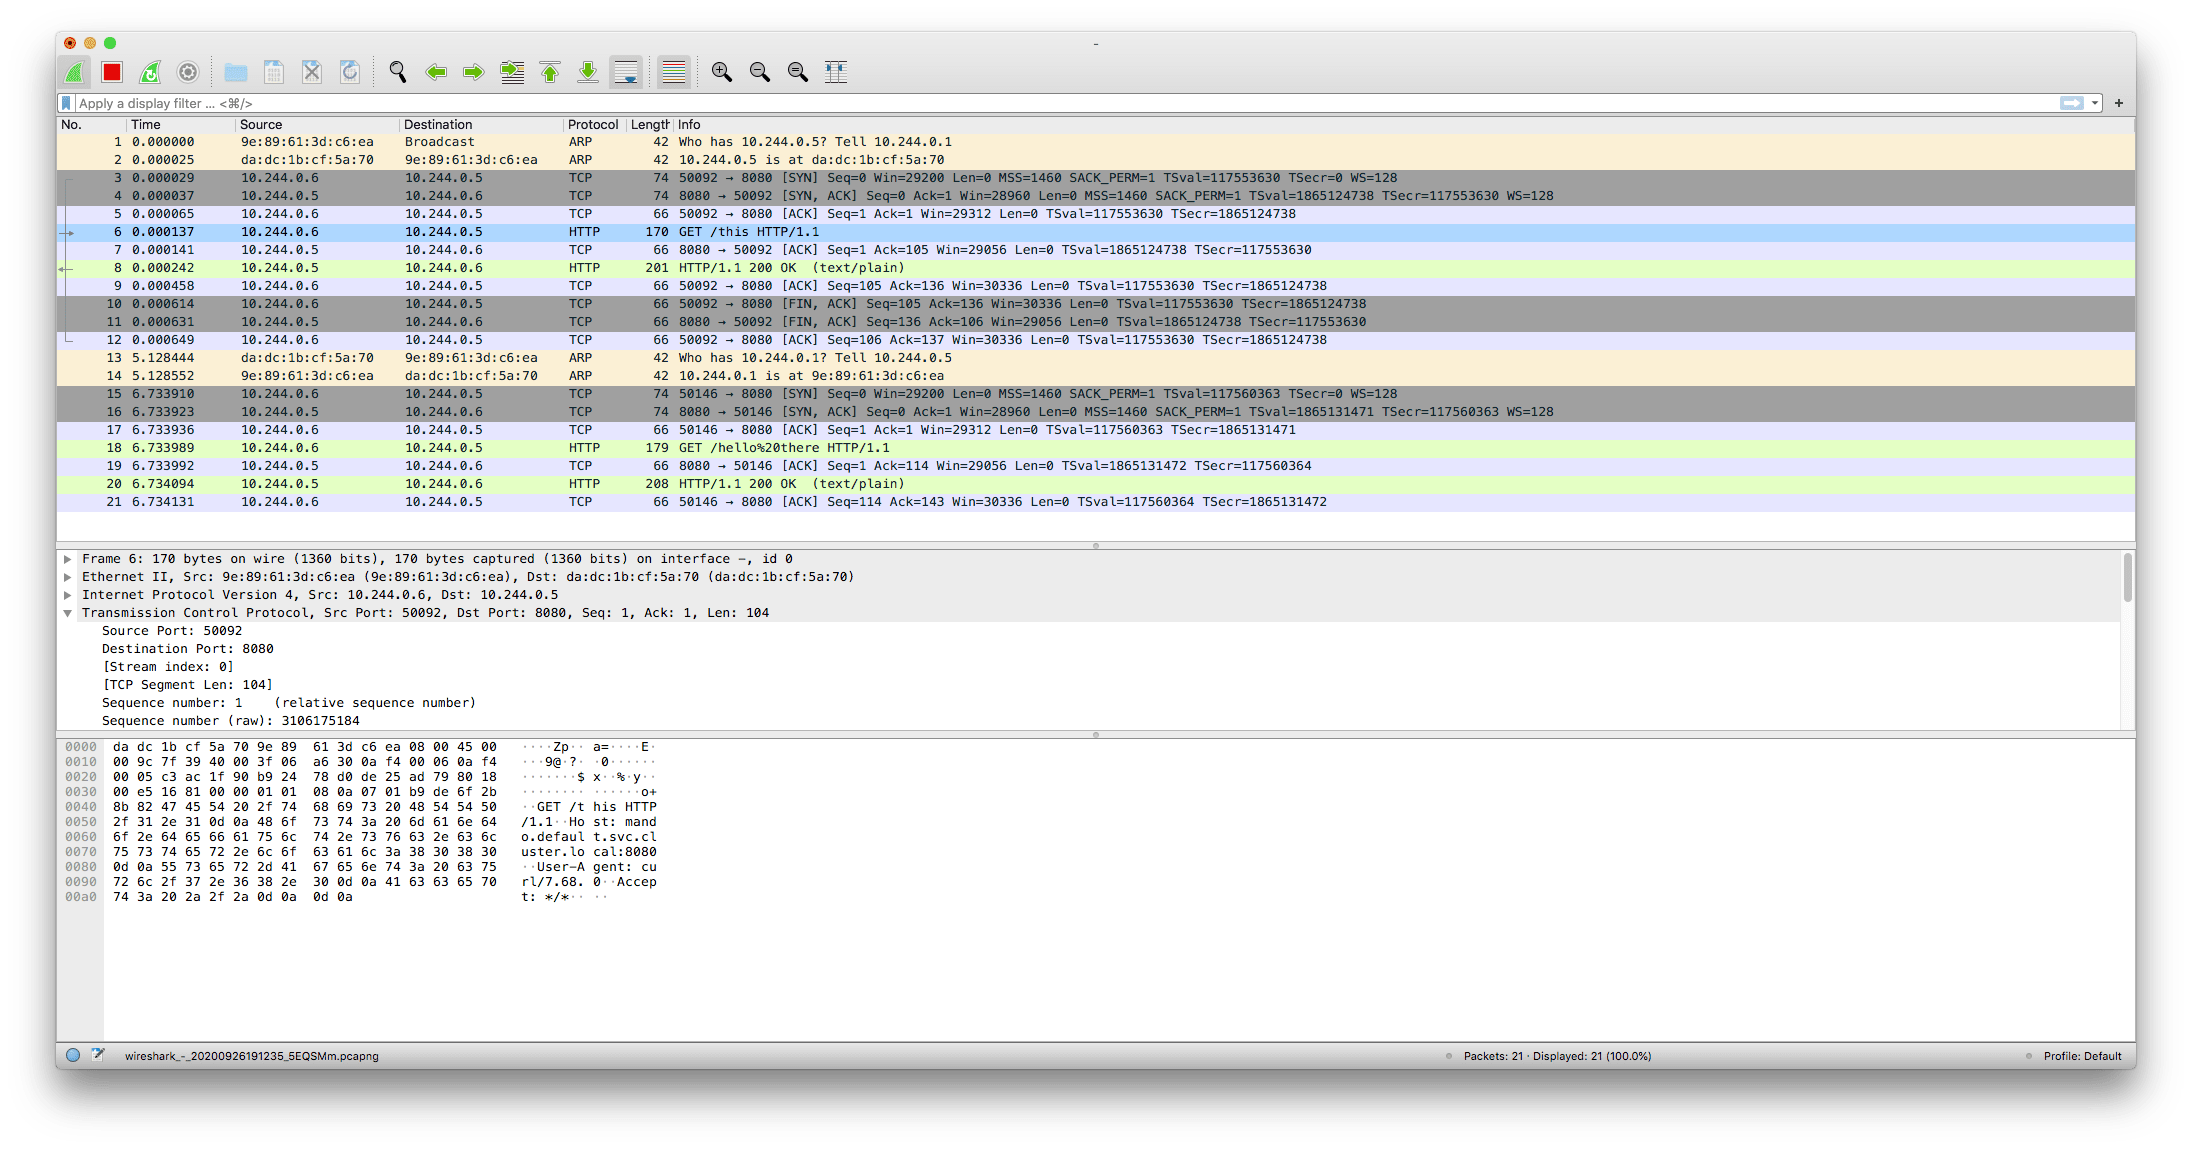
Now that I had tcpdump installed, I could run it and pipe the output to Wireshark on my local machine.
kubectl exec my-app-pod -c nginx -- tcpdump -i eth0 -w - | wireshark -k -i -
It was pretty slick, if I do say so myself, and made me feel like a Hackers character. 😎
There’s some issues with this, though. 😳
- I had to
kubectl execand install arbitrary software from the internet on a running Pod. This is fine for internet-connected dev environments, but probably not something you’d want to do (or be able to do) in production. - If this app had been using a minimal
distrolessbase image or was built with a buildpack I wouldn’t have been able toapt install. - If I rebuilt the app container image to include
tcpdumpthat would have required the Pods to be recreated. Not ideal if the bug is tricky to reproduce.
So installing tcpdump as needed isn’t always an option. Why not just include it when building the initial container image for the app so that it’s always available? That path leads to image bloat and the more unecessary packages we include in our image the more potential attack vectors there are.
So what else can we do?
Fortunately for us, newer versions of Kubernetes come with some alpha features for debugging running pods.
Ephemeral Debug Containers
Kubernetes 1.16 has a new Ephemeral Containers feature that is perfect for our use case. With Ephemeral Containers, we can ask for a new temporary container with the image of our choosing to run inside an existing Pod. This means we can keep the main images for our applications lightweight and then bolt on a heavy image with all of our favorite debug tools when necessary.
For the following examples I’ll be using my mando app which is running as a Pod named mando-655449598d-fqrvb. It’s built with a Go buildpack (you can read more on that here), so it’s the perfect example of an app with a minimal image.
To demonstrate how this can be hard to work with, let’s first try to open a shell in it the traditional way.
kubectl exec -it mando-655449598d-fqrvb -- /bin/sh

error: Internal error occurred: error executing command in container: failed to exec in container: failed to start exec "3ca55f9b6457995be6c6254a8d274706e42d89f431956b5b02ad9eade5e5f788": OCI runtime exec failed: exec failed: container_linux.go:370: starting container process caused: exec: "/bin/sh": stat /bin/sh: no such file or directory: unknown
No /bin/sh? That’s rough. Let’s provide a shell with an Ephemeral Container using the busybox image:
kubectl alpha debug -it mando-655449598d-fqrvb --image=busybox --target=mando -- /bin/sh

If you don't see a command prompt, try pressing enter.
/ # echo "hello there"
hello there
/ # ls
bin   dev   etc   home  proc  root  sys   tmp   usr   var
Now we can do all sorts of shell-like activities!
For our use case, though, we want to capture network packets. So let’s use an image that’s optimized for network troubleshooting: nicolaka/netshoot.
We can use kubectl alpha debug with run tcpdump and pipe the output to our local Wireshark just as we’d done before!
Here’s a concrete example of me using tcpdump to capture packets on the eth0 interface:
kubectl alpha debug -i mando-655449598d-fqrvb --image=nicolaka/netshoot --target=mando -- tcpdump -i eth0 -w - | wireshark -k -i -
Since I’m using Istio as my service mesh, capturing packets from eth0 primarily shows traffic to and from the Envoy sidecar proxy. If we want to debug traffic between the proxy and the mando app itself we can do the same thing against the lo (loopback) interface:
kubectl alpha debug -i mando-655449598d-fqrvb --image=nicolaka/netshoot --target=mando -- tcpdump -i lo -w - | wireshark -k -i -
I’ve found both of these commands to be invaluable when debugging the service mesh interactions on my clusters.
Caveats
As of Kubernetes 1.19, Ephemeral Containers are still an alpha feature and are not recommended for production clusters. So chances are you won’t have access to them yet in your environment. As an alpha feature, the interface and functionality of the feature is liable to change, so don’t get too attached to the current implementation! It’s such a useful feature, however, I’d doubt they’d cut it entirely.
There are still ways to get early access today, though.
If you’re using a managed Kubernetes service like GKE you can create an (unsupported) alpha cluster that will have all sorts of experimental features enabled. I’m less familiar with other managed offerings, but chances are they’ll have some form of alpha release channel was well.
Or if you’re running a local kind cluster, BenTheElder shows how you can enable ephemeral containers here with the following kind config:
kind: Cluster
apiVersion: kind.x-k8s.io/v1alpha4
featureGates:
  EphemeralContainers: true
If you’re using a custom kubeadm deployed cluster, you can configure the Kubernetes control plane components to run with the --feature-gates=EphemeralContainers=true flag.
Alternatives
If for some reason you can’t enable ephemeral containers and you really want to capture some packets, don’t despair! 😌
Check out ksniff as an alternative. It can create a privileged Pod that will create a new container that shares the same network namespace as your target Pod and let you capture packets that way.
If you can’t run privileged pods and can’t add tcpdump to the container image yourself, well…
I’m sure you’ll figure something out.
Best of luck! 🙂